Functional overview of Tecap Automated Test Suite
Here you find more details about the many functions and possibilities provided by Tecap.
Project Overview
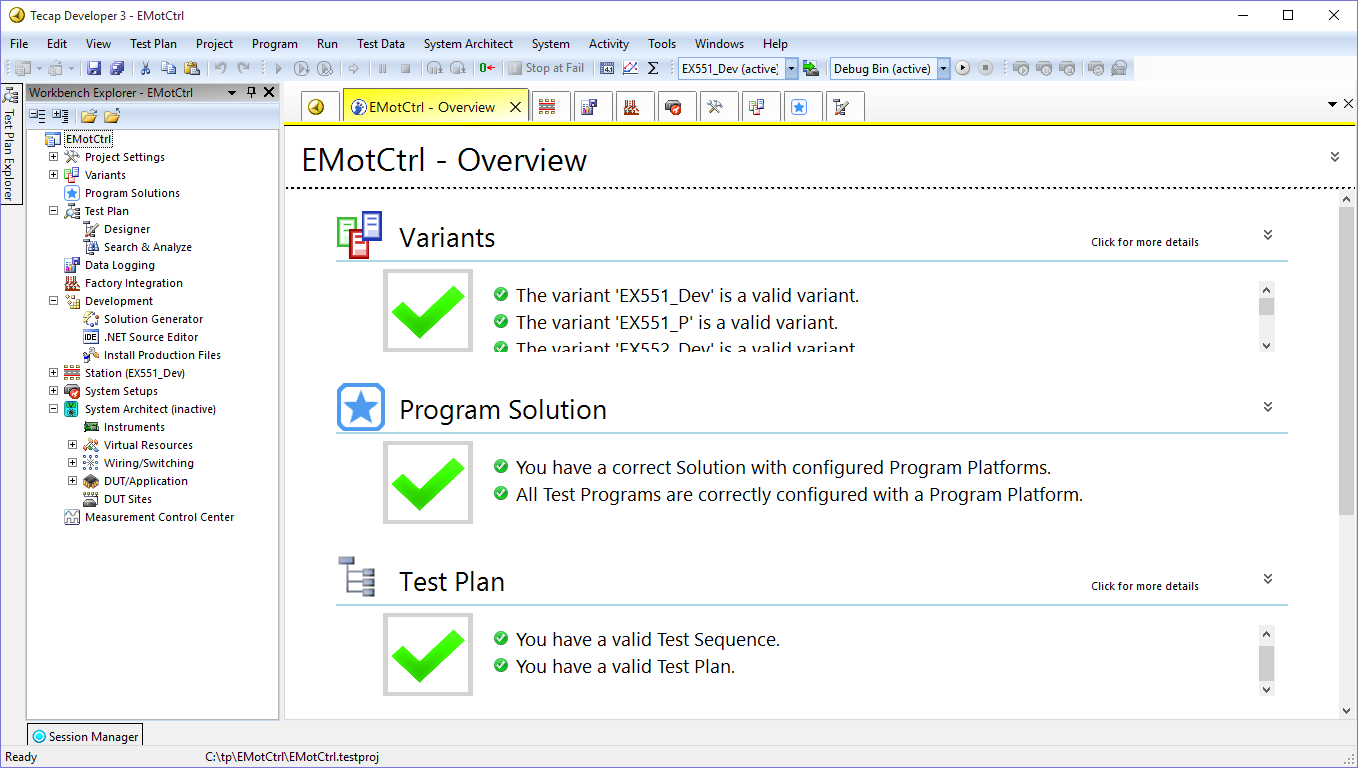
Project overview shos information about the actual configuration.
- Information about all config elements
- The whole project on one page
- Simplifies the access to a Tecap project
- Hints about missing config elements
- all critical configuration breaks/errors at a glance
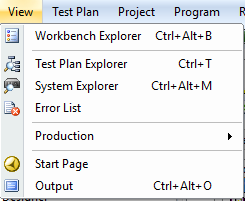
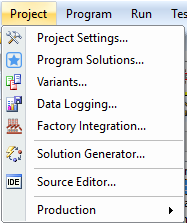
Workbench Explorer
All essential elements can be started from the Workbench Explorer.
- Project settings
- Test Plan
- Data Logging
- Factory Integration
- Developer Tools
- Test system configuration
Test Plan Explorer – Test Groups
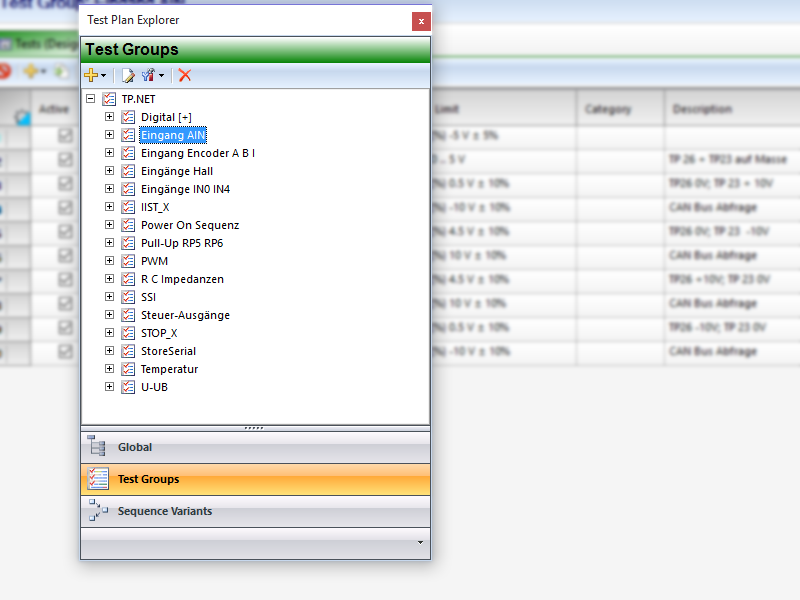
The Test Plan Explorer helps at the navigation through the Test Plan elements Test Groups, Sequence Variants und several global Test Plan settings.
- Listing of all Test Groups
- Listing of the Test Group usage within the Sequence Variants
- Clone functionality
Test Plan Explorer – Sequence Variants
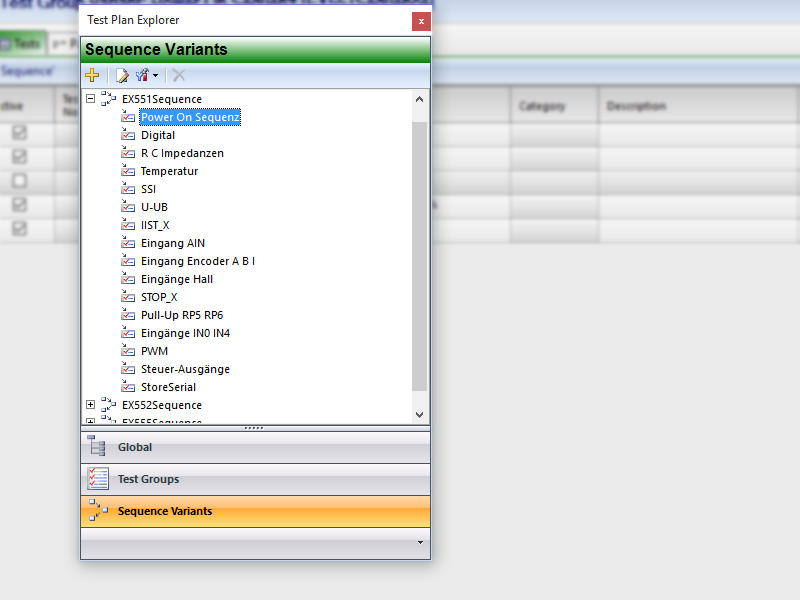
The Test Plan Explorer helps at the navigation through the Test Plan elements Test Groups, Sequence Variants und several global Test Plan settings.
- Listing of all Sequence Variants
- Listing of the Test Group usage within the Sequence Variants
- Clone functionality
TestPlan Support
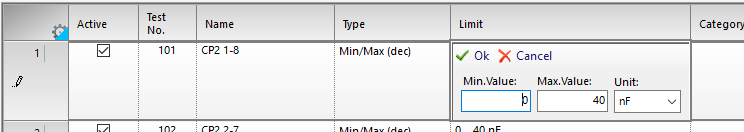
- Limit specific input help
- Simpe cell content handling
- Switchable to pure text operation
- Different limit types for diverse test situations
- Physical units
Test Plan Export
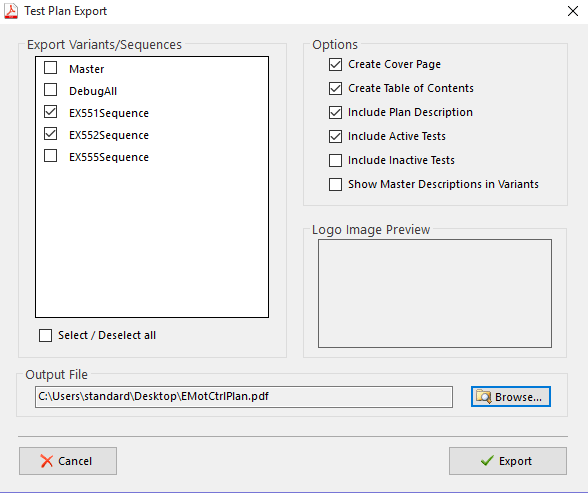
For documentational or communicational purpose, the Test Plans can be exported to PDF files.
- Generates PDF-files from a Test Plan
- Selection of Sequence Variants
- Several layout options
- Integration of userdefined logos
- PDF file for internal discussions or
- … as test coverage documentation
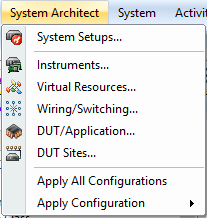
System Setups
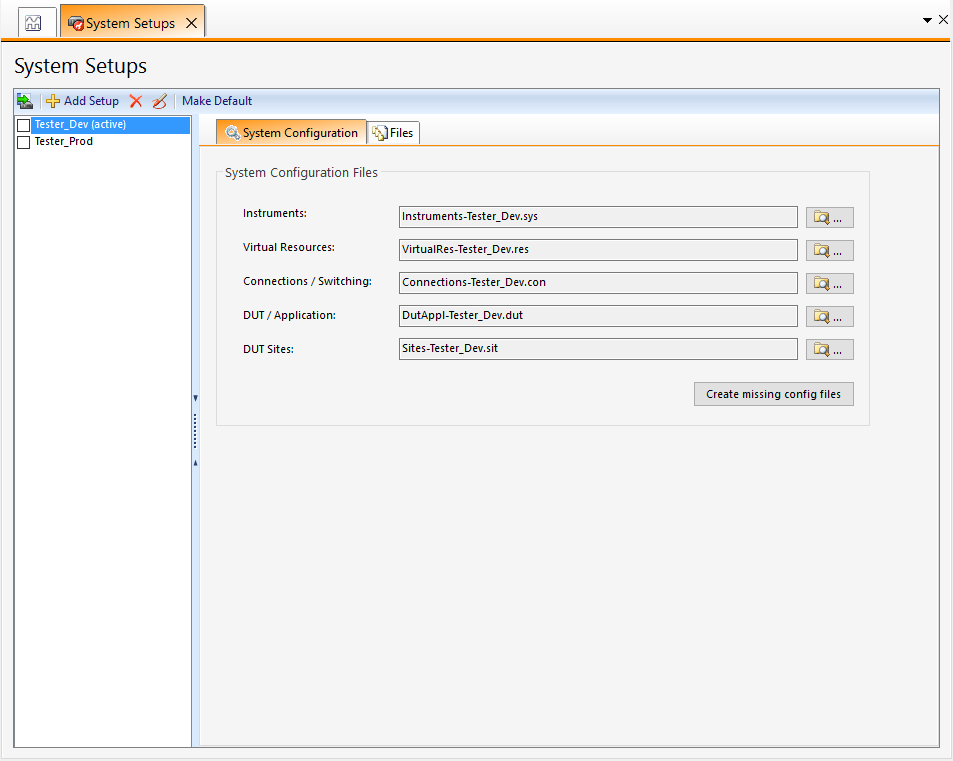
The "System Setups" contains all system configurations. Variants, production or development states can be executed on different systems. Extremely precise instruments for prototypes and pilot series, fast instruments for mass production.
- Configurable test system setups
- Several system setups per project
- Setups for example for prototypes, pilot series or mass production
- Setup exchange by configuration change
Instruments Configuration
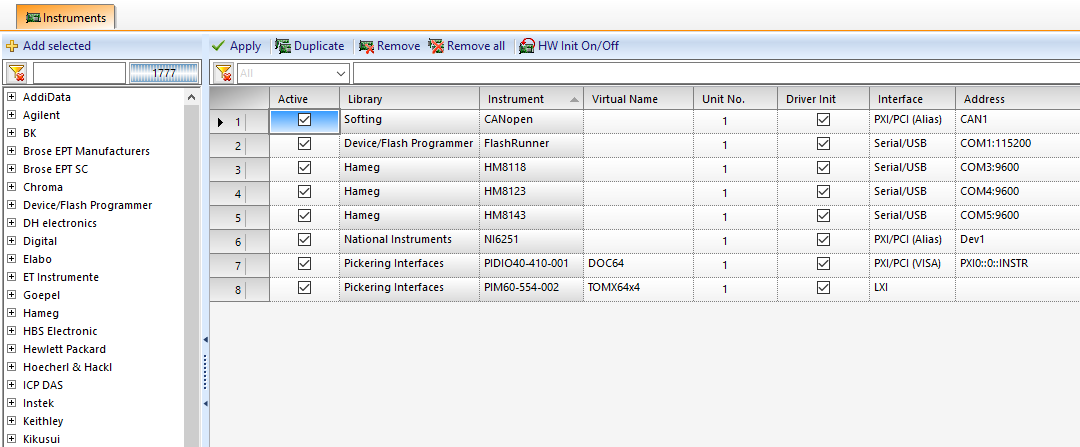
Instruments Configuration configures the physical instrument connection to the host PC. Every instrument knows its connection options.
- Instruments configuration
- Port configuration GUI for each connection option
- First virtualization for instrument classes
Instruments – Filter
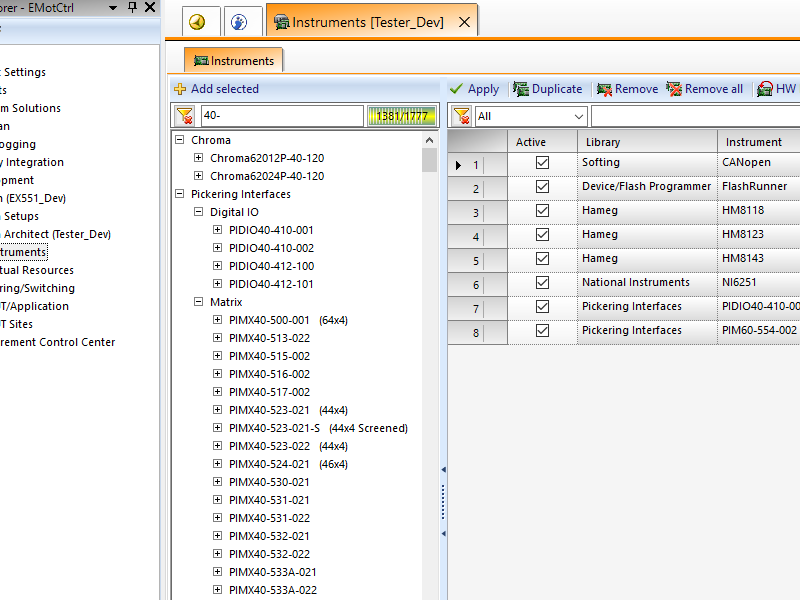
A integrated Filter helps finding your instruements within the instrument library
- Listing of all instruments
- Filter
- Indicator for the instrument count or the instruments, which match your filter
Supporting GUI
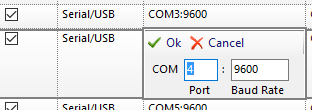
Most of the tabular presentation screens have their own GUI integrated, to help the user while entering data.
- Cell specific supporting GUI
- Simple editing
- Switchable to pure text mode
- No know-how about contents behind
System Explorer
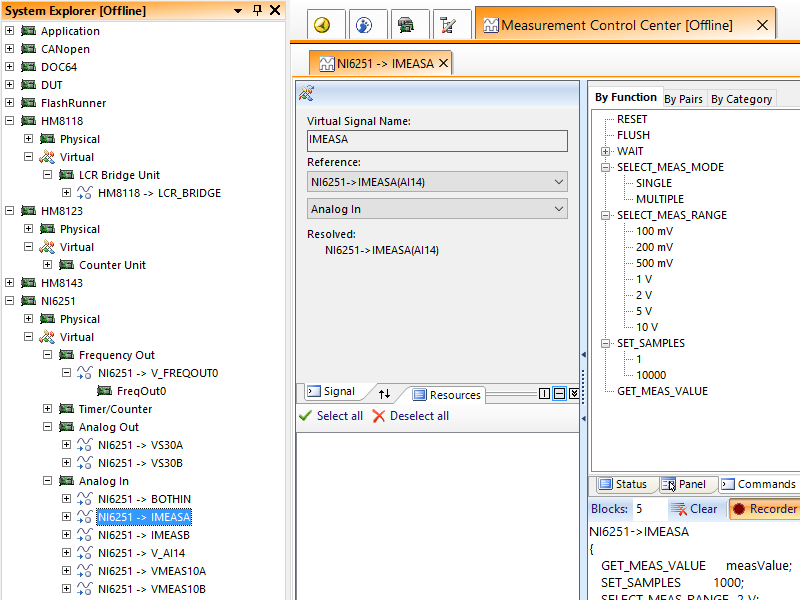
System Explorer is part of the Measurement Control Center and lists all configured instruments. One click on a instrument opens its graphical user interface.
- Listing of all test system instruments
- Virtual and physical instruments
- Unifom handling of all instruments
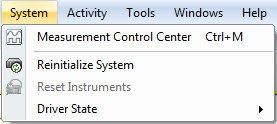
Measurement Control Center
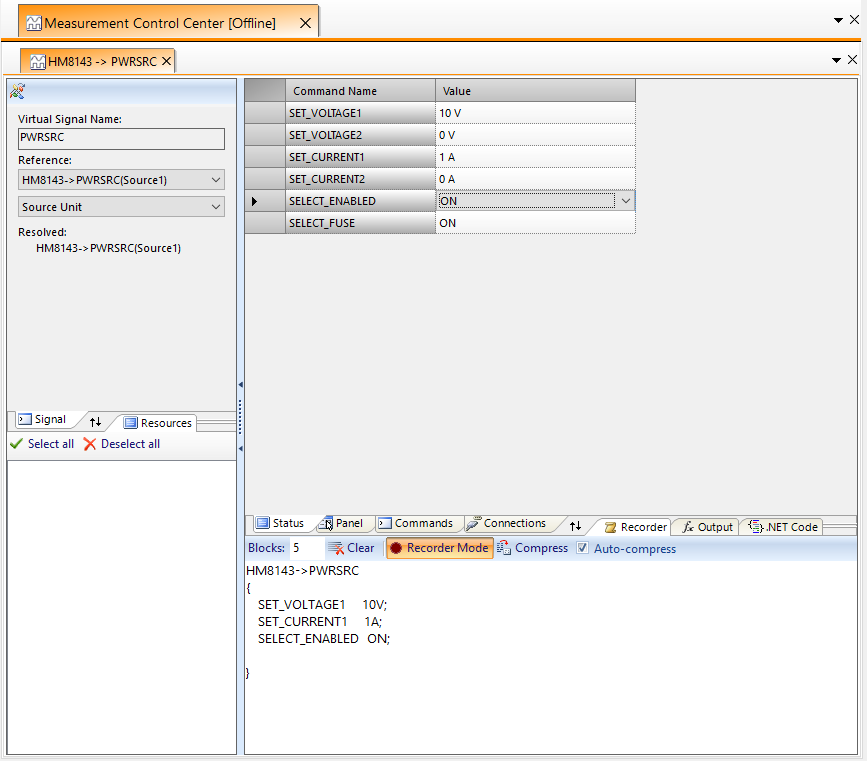
Measurement Control Center controls all instruments. The integration in the instruments pack makes a uniform handling of all instruments possible and every instrument sends and reads through the same interface with human readable text commands.
- Keywords for command based programming
- Uniform programming of all instruments
- Simple keywords, wich reflect the real functionality
- .NET Code Recorder, which allows to copy/paste instrument keyword code to the test program
- Panels for point and click programming
- Supports master instruments, which summarize several instruments to one (e.g. a DMM with multiplexer, signal conditioning cards , etc.)
- Listing of all In/Outputs
- Board -> Channel -> Micro Resource Design
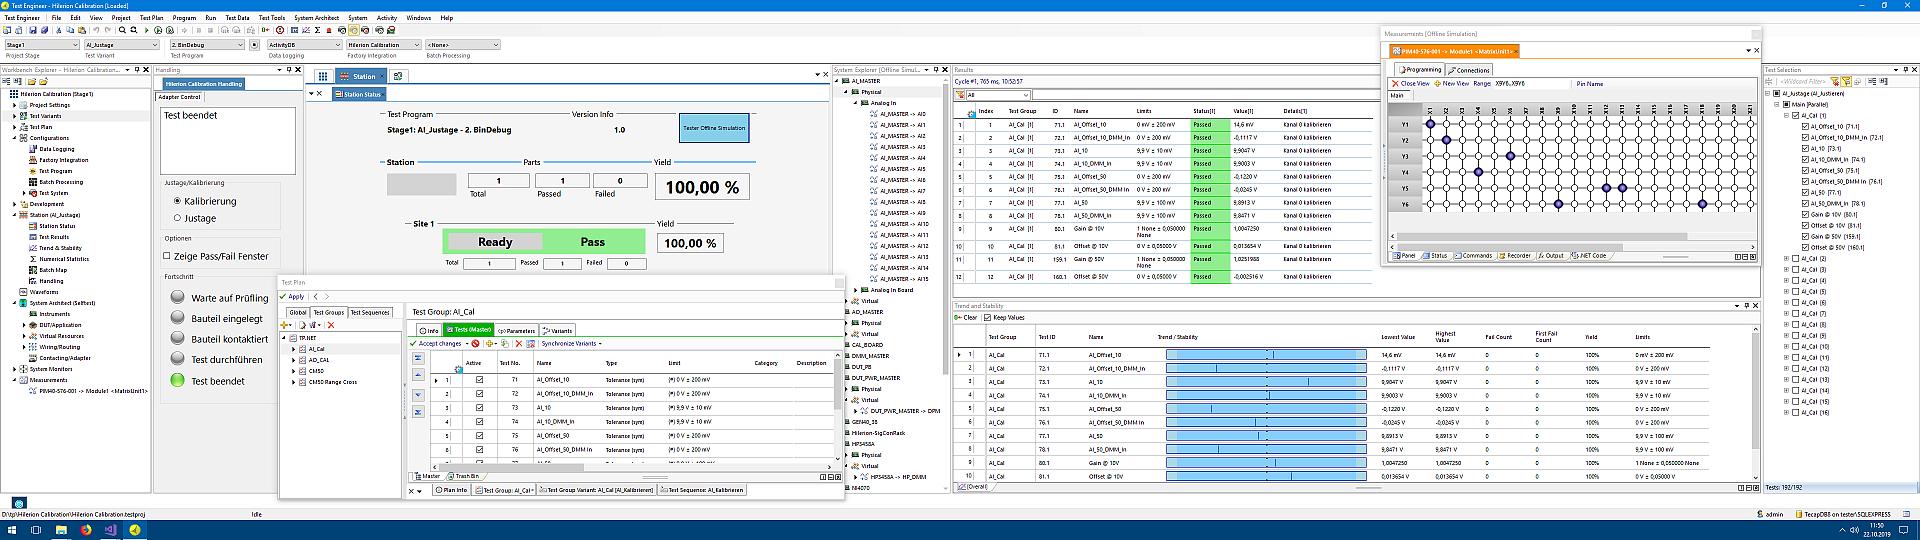
Matrices
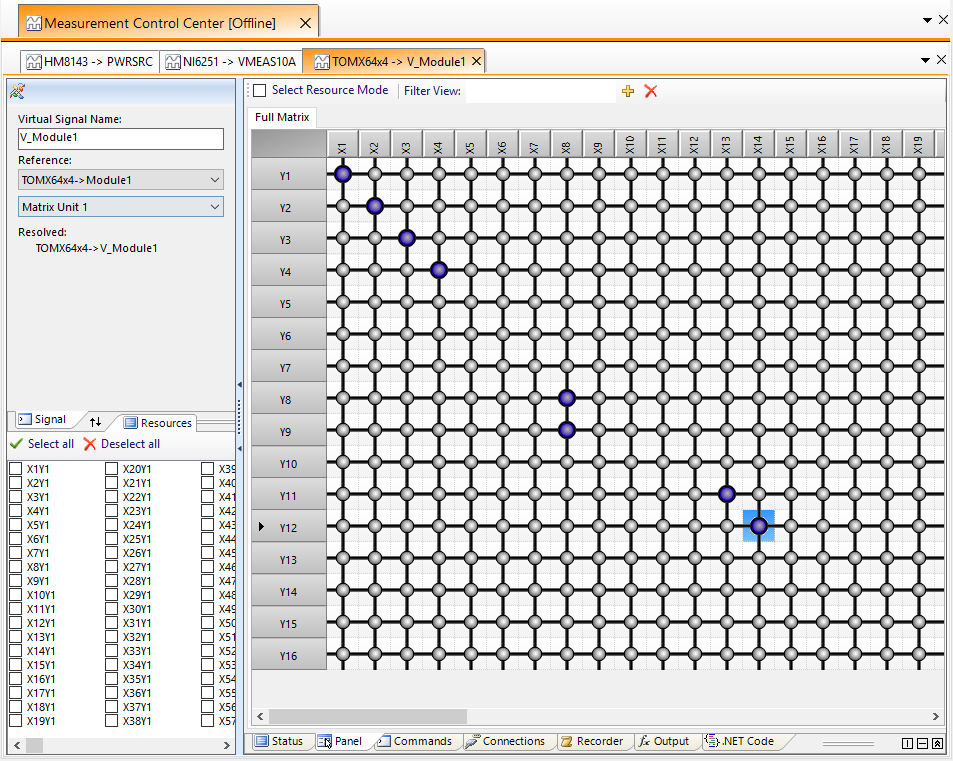
- Graphical switch status visualization
- Point and click activation
- Fully integrated into our routing algorithm and thereby support for keyword based switching
- Partial view filter
- Status panel
DUT Site Signals and Multiplex Signal Definition
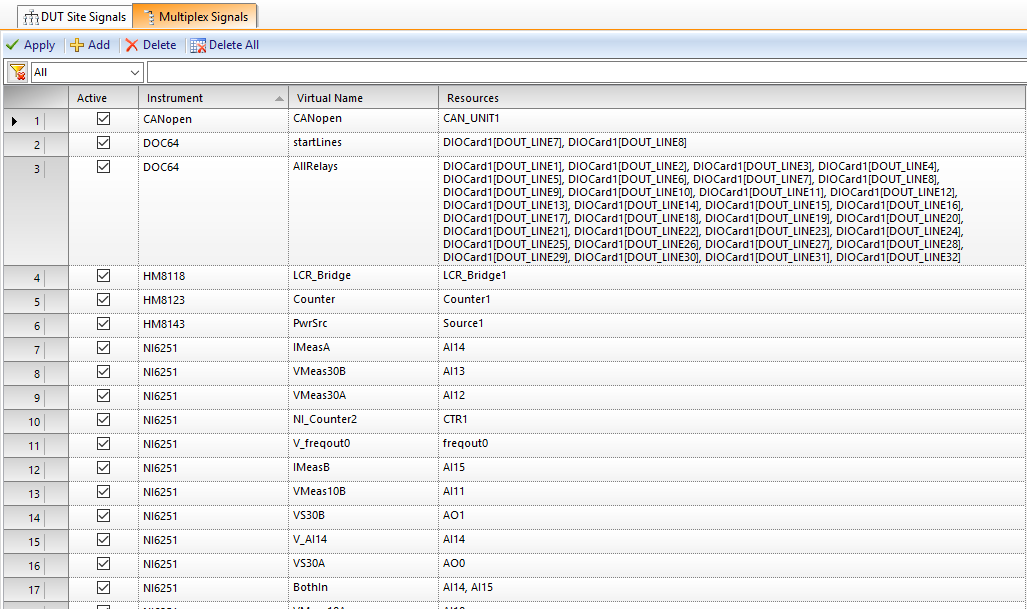
"DUT Site Signals" offers a for the parallel test optimized virtualization. For each test site, a stimulation and measurement instrument is defined. (Site1: DMM1, Site2: DMM2,…) Programming is done on freely definable virtual instruments. Data handling is done within Tecap and you do not have to program any loops. The test projects are fully scalable.
"Multiplex Signals" allows, to define one or several channels to one keyword, e.g. several analog input channels to the virtual channel "ALL_IN".
Both methods allow human readable code, which has a clear reference to the DUT.
- Listing of all defined signals
- Virtualization of signal names
- Mulitple virtualization
- Grouping of already virtualized signals
- Filter
- De/activation for every signal
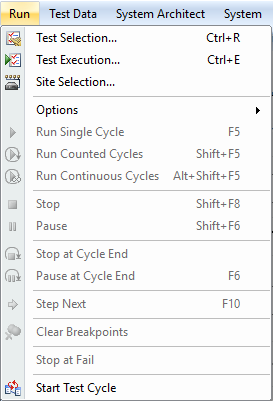
Test Selection
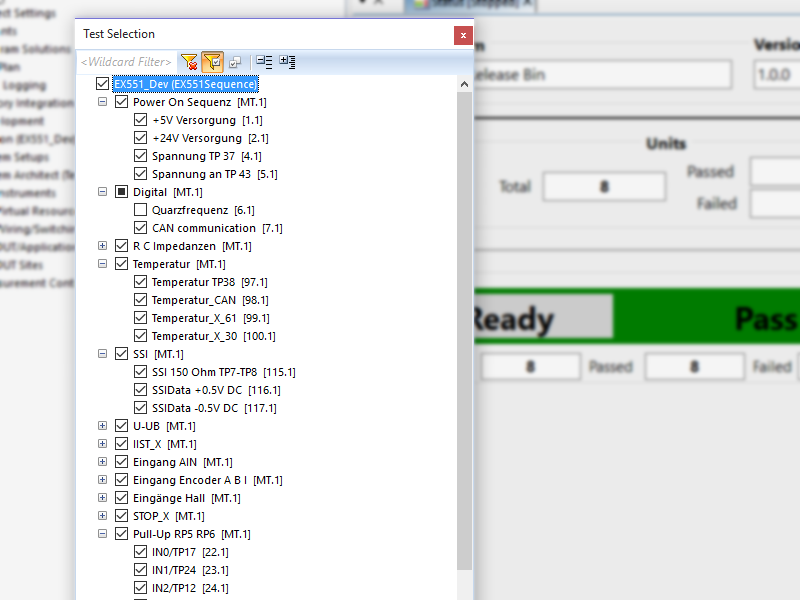
For start-up or selective testing the Test Selection provides temporary de/activation of tests and test groups.
- Test selection
- Temporary de/activation of single tests or whole test groups
- Filter with switchable automatic de/activation by filtering
Test Execution
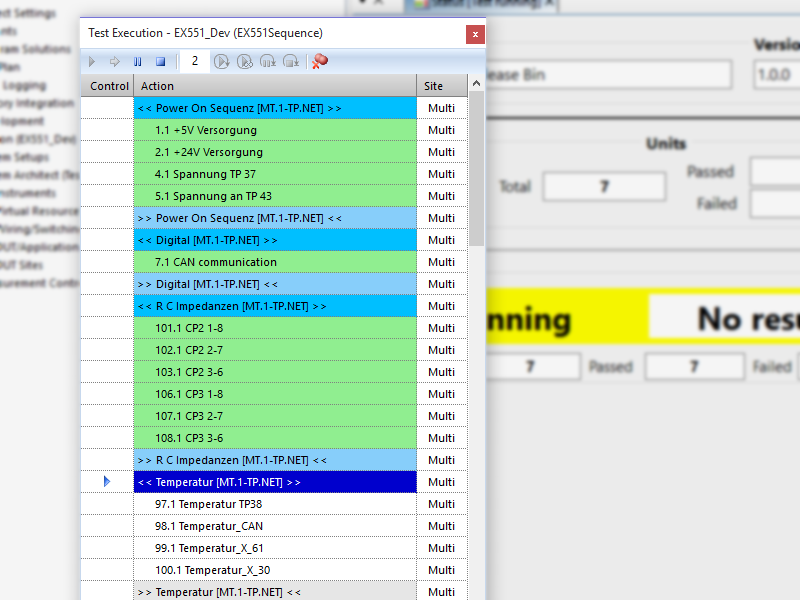
Test run visualization of all Tests within the Test Groups and the corresponding Test Group events.
- Single-Run
- Counted-Run: Loops by the set loop count
- Continous-Run
- Instant Pause/Stop
- Pause/Stop after cycle end
- Sequence breakpoints
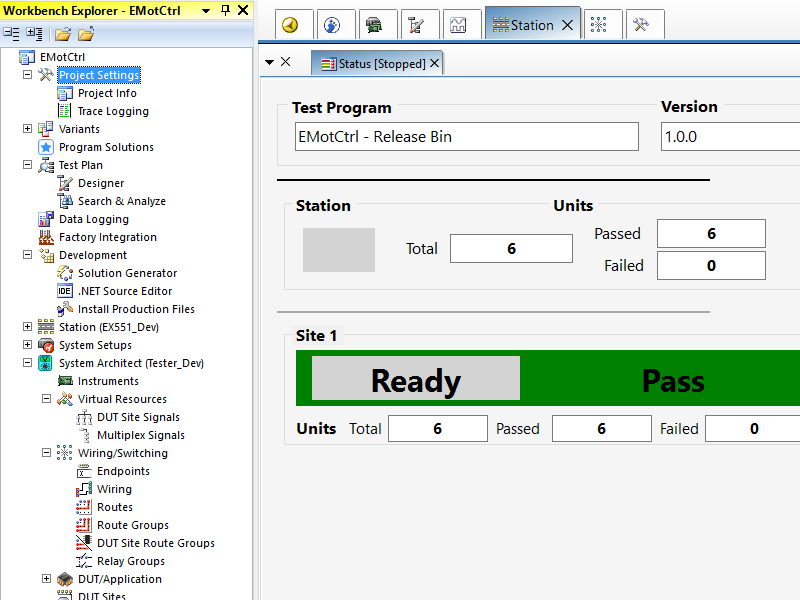
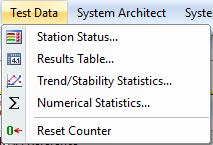
Test Status
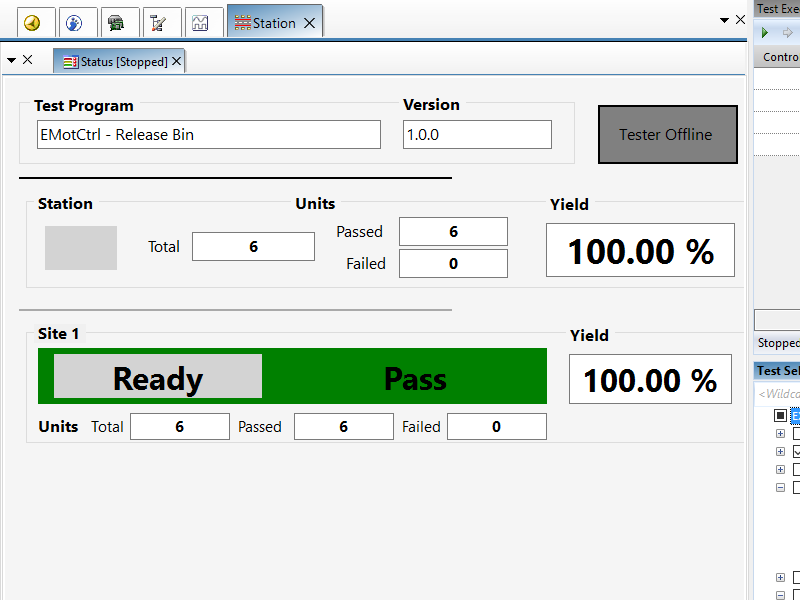
Test Status shows information about the actual test session.
- Loaded project
- Testsystem status
- Tested parts count
- Pass, Fail count and the calculated Yield
- automatic view extension for parallel test
Test Results
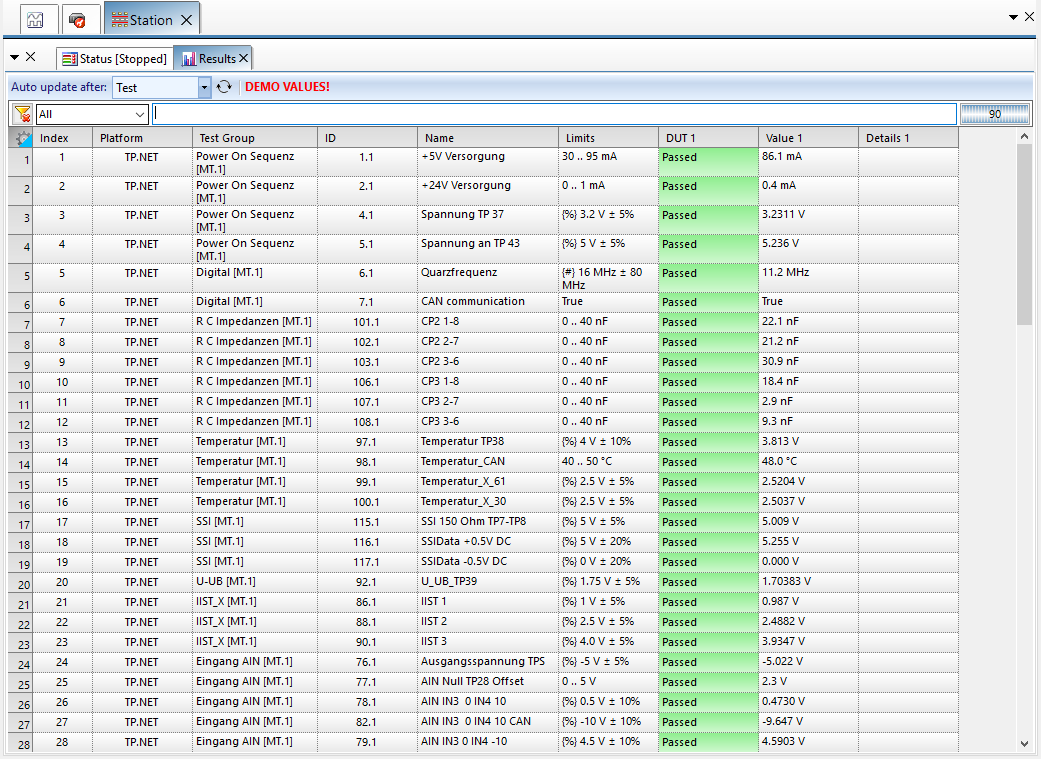
Listing of all configured tests
- Visualization of all test relevant data
- Configurable columns
- Result update per Test, per Test Group or per cycle
- Free text filter
- Automatic foresighted scrolling
Trend and Stability
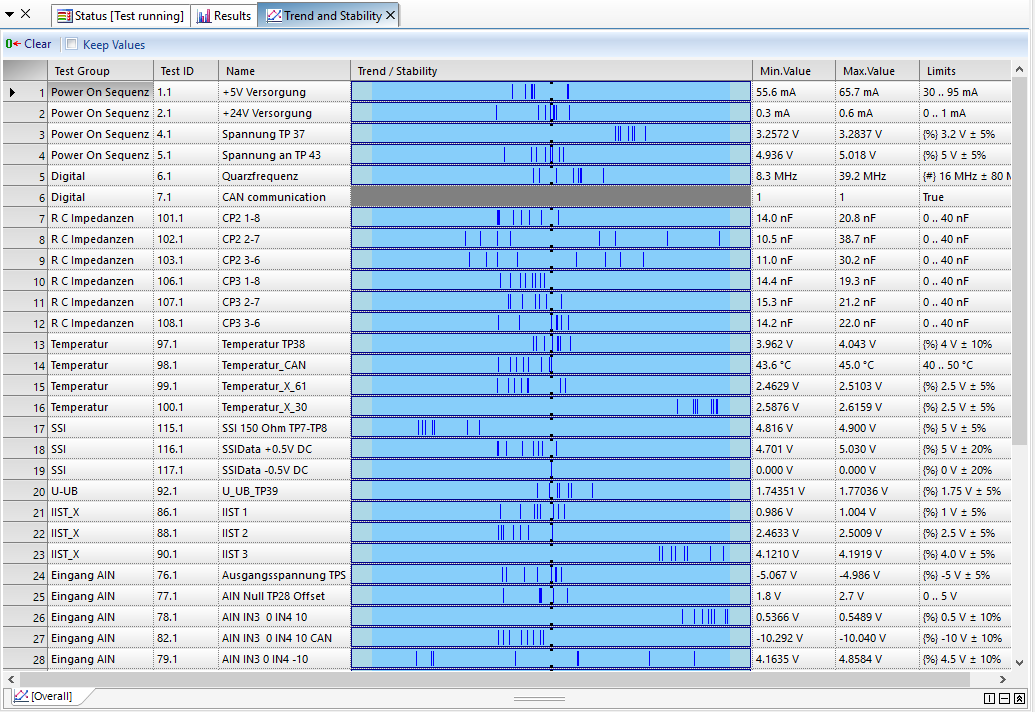
Tecaps Trend and Stability informs you about the measurement stability per test.
- Integrated trend- and stability analysis per test
- Minimal und maximal values per Test
- Support for single and continuous run
Numerical Statistics
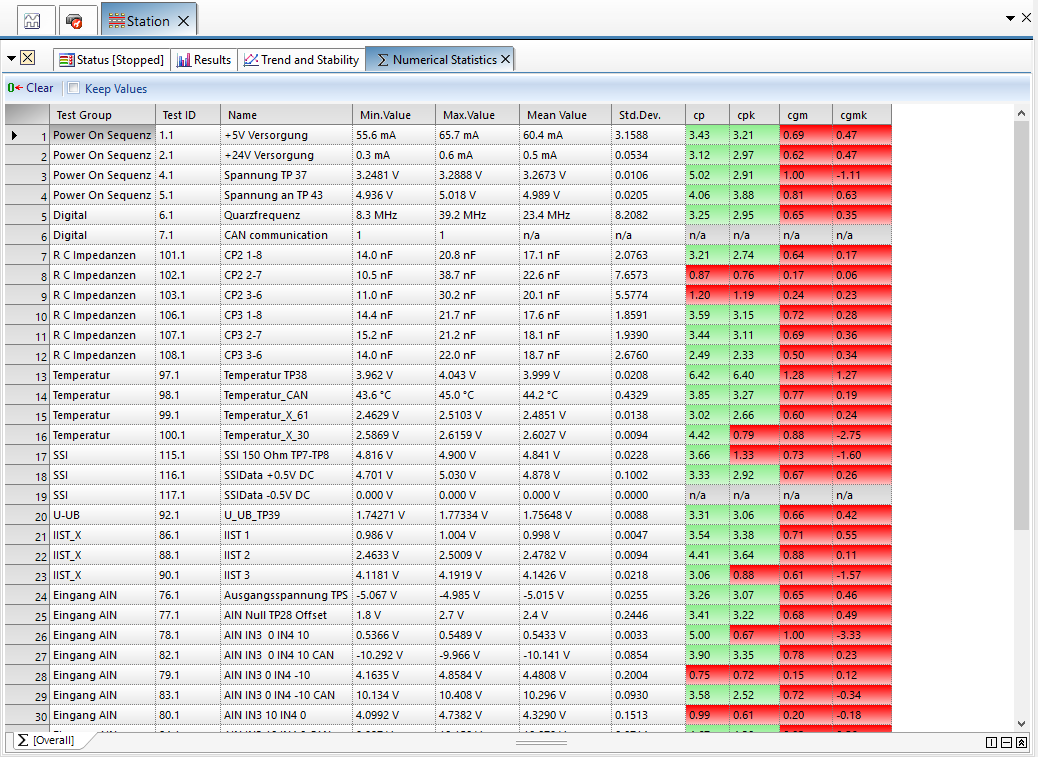
From the second run, Tecap shows data in the Numerical Statistics .
Process and machine capability can be checked within Tecap.
- Integrated numerical statistics per test
- Automatic recording of minimal, maximal, average, standard deviation, cp, cpk, cgm, cgmk
- Support for single and continuous run
- Additional site specific evaluation for parallel test
Gridview Configuration
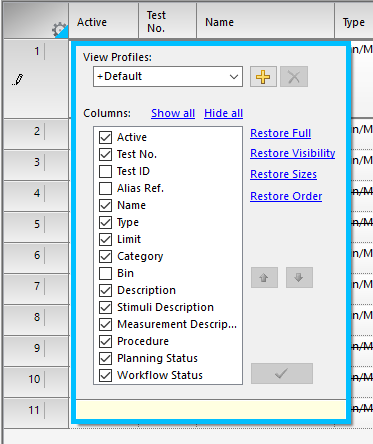
Tecap supports the user in all tabular presentations with the opportunity to select the data to be shown.
- Each gridview can be configured to personal requirements
- Different configurations for different tasks
- Individual column sort
- Enhanced general view
Solution Generator
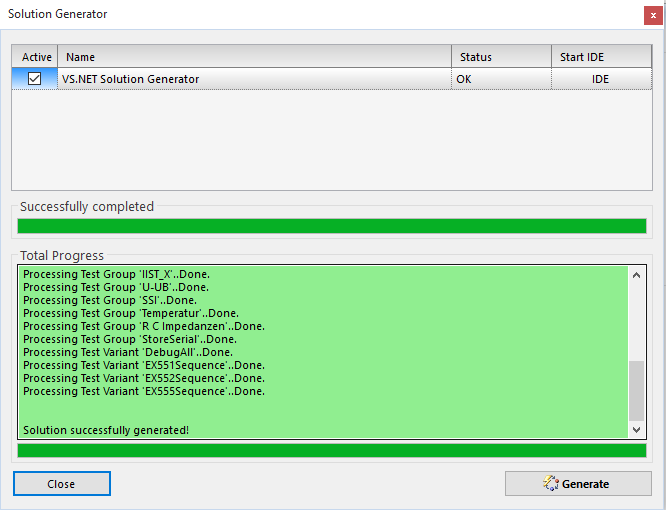
Solution Generator creates a .NET project based on templates and the project Test Plan.
- Generates from the Test Plan test specification a .NET Project
- Visualization of all generated Test Groups and Test Variants
- Direct link to the IDE
- Simple project handling by user defined templates
DUT (Device under Test)
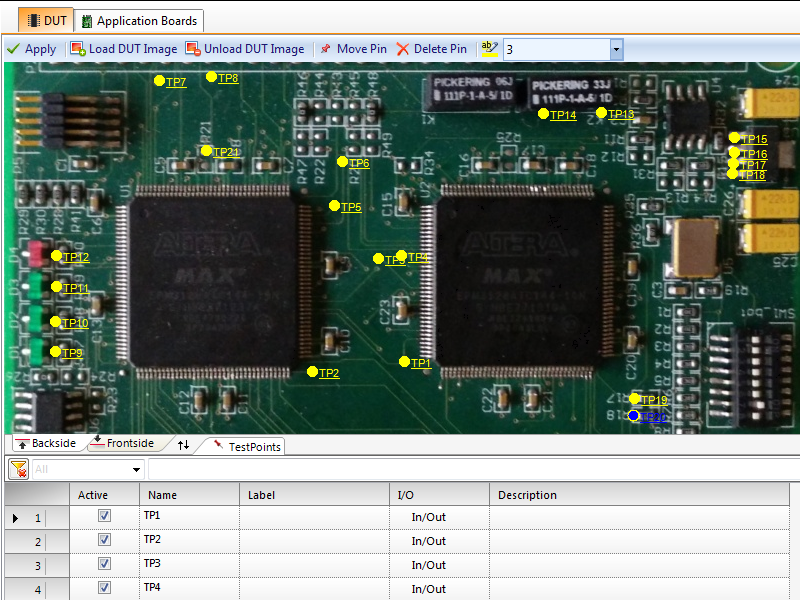
Tecap not only knows the instrument connections, but kennt nicht nur die Anschlüsse der Instrumentierung, but can additionally learn the DUTs connections. Test points and connectors can be used in the system wiring.
- Optical DUT visualization with front and rear
- Free settable test points on front and rear
- Alias names
- Test point description
- Test point usage in the system wiring (Hard Wires, Routes, etc)
Application Boards
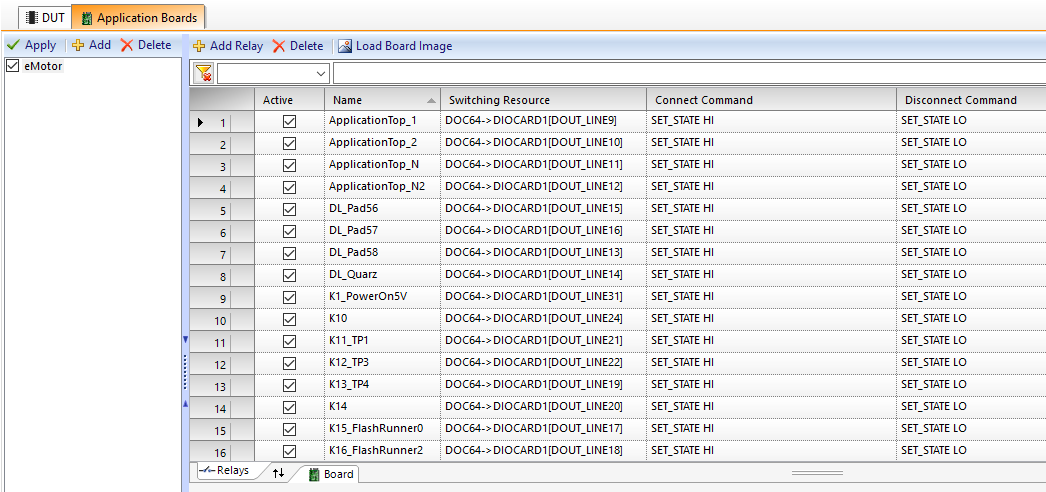
Each project can have several application boards. Active elements, which can be activated by system compontents (load relay by OC/DigitalOut/RelayCard,…) can be added and integrated into the system wiring.
- Full integration of application board elements into the system setup
- Switch resource definition per element
- Integrated into routing and thereby automatic switching of load relays or smiliar
- Project wide usage by name
DUT Sites
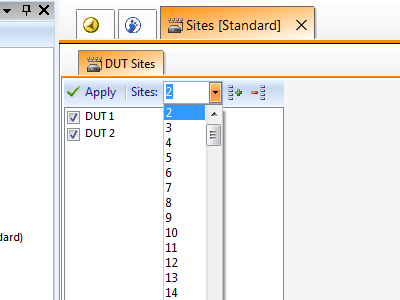
Tecap is designed for parallel test. Thorugh virtualization instruments can be configured to the corresponding DUT. The wiring creates the concrete hardware reference.
Under ideal conditions, the project can be scaled from single site to multi site parallel test without touching the source code.
- Site definition for parallel test
- Simple De/activation of active DUTs
Endpoints
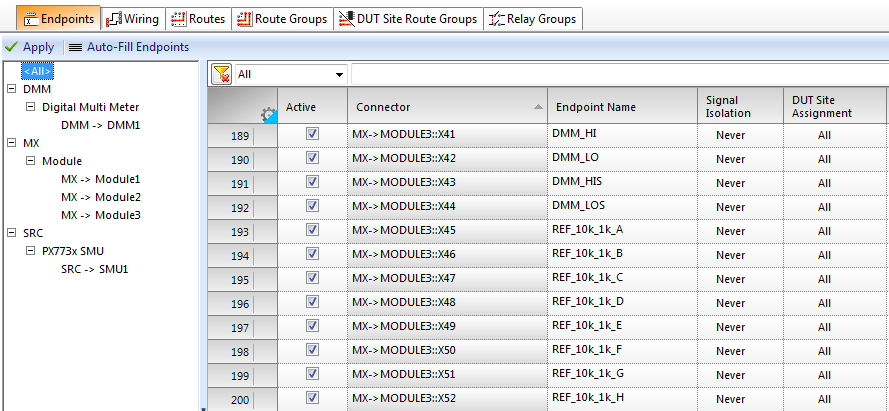
Endpoints are a component of the system connection setup. Every single connection can get a user defined name. This enhances the software reference to the DUT and the tracebility through the system.
- Naming by pin
- Description fields for documentaion
- Site definition for parallel test
- Signal isolation
Wiring
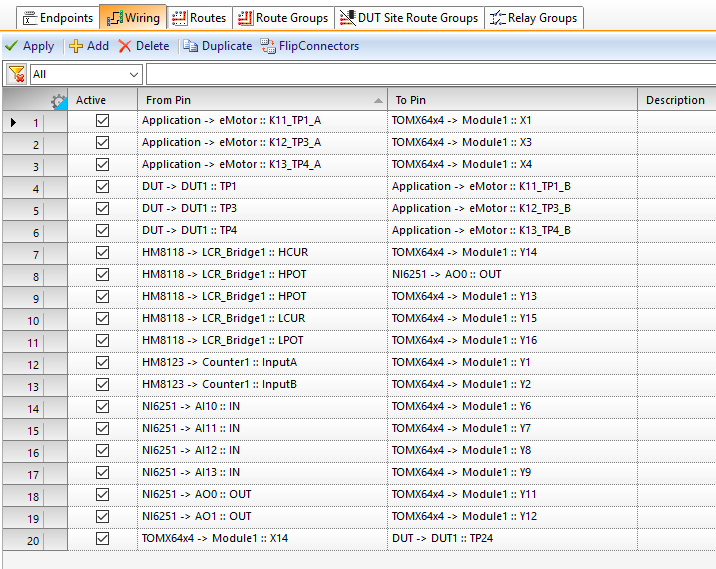
All wire connections are defined within Tecap. Cable connections, pcb track, however your system components and DUT is connected to each other – Tecap knows the connections and routes from pin to pin.
- System connection base
- Pin-to-pin connection for the whole test setup
- Automatic system connection documentation
- DUT integration
Routes
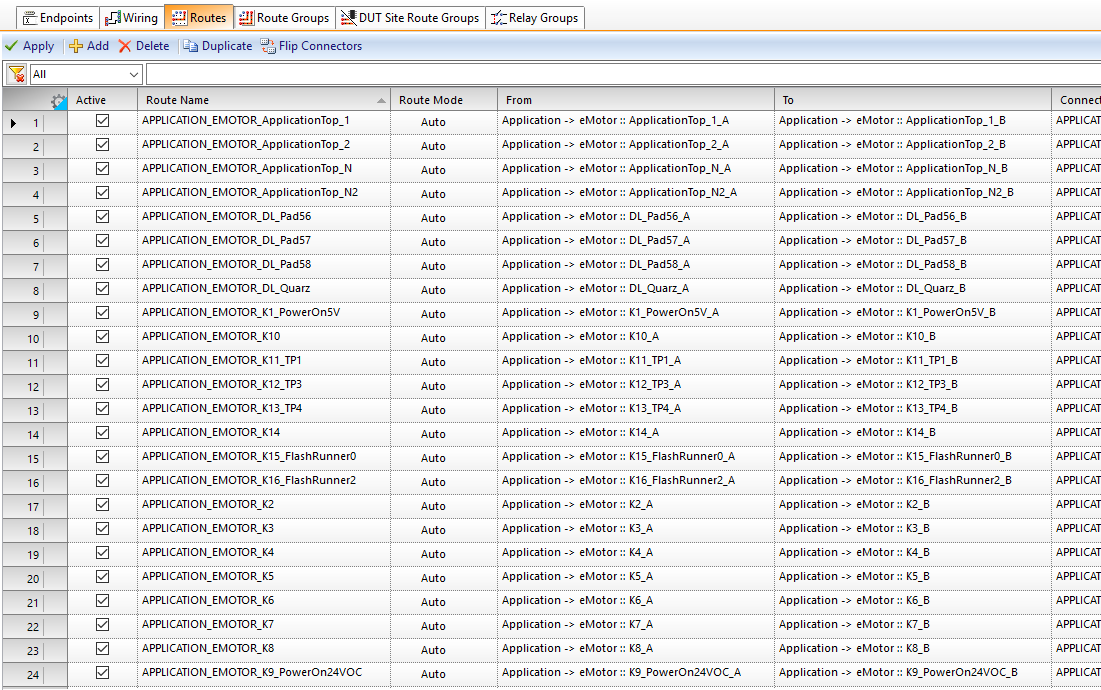
Routes describe the ways through the test system. Regardless of which type of instrumentation is used, routes along the cards will switch relais, digital outs, multiplexers, and so on.
- Routes for switching
- Switching by logical names
- Any amount of switch elements per route
- Predefined static routes
- Dynamic routes, which are calculated at runtime
- Short circuit detection
Static Routes
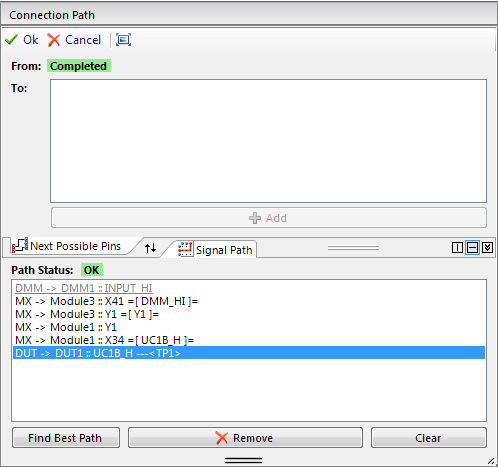
If a predefined route is favored, you can also use static routes instead of the autorouter.
- Support at design time by showing only possible lines
- Automatic route finder will suggest a route
- Clone and part replacement of existing route segments
Variant Configuration
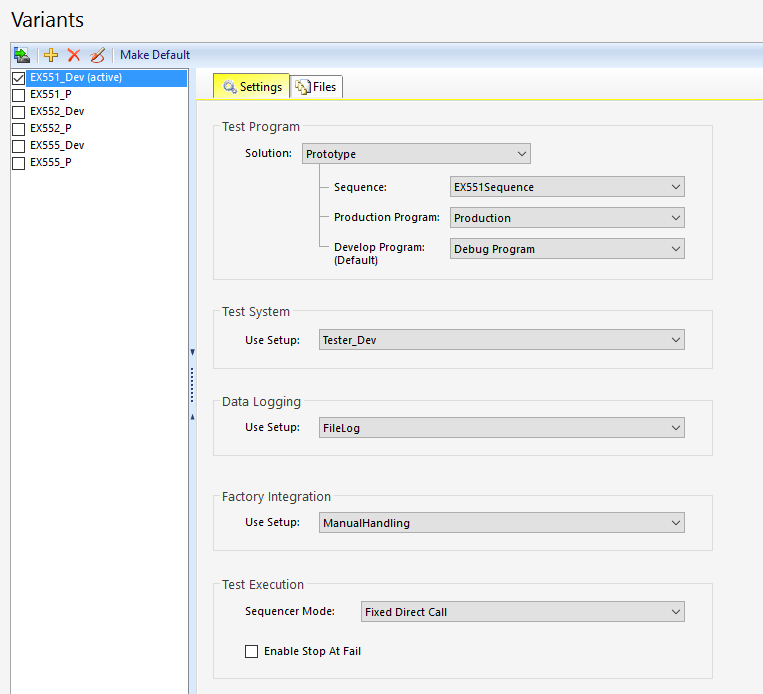
All prior definded configuration elements configure:
- Solution
- Test Plan Sequence
- Test Program
- Test System
- Data Logger
- Factory Integration
to one unit.
Datalogging
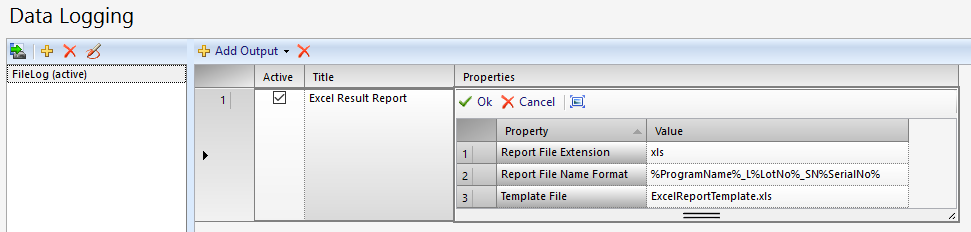
Configurable data logger can be attached per Variant. Independently from if you want to store into a databse or into the file system, Tecap does this job for you.
By this means, different profiles for development and evalutation can be used, than for mass production.
The test program itself contains no datalogging related source code.
- Open data logging interface
- Data logger are attached by configuration
- Several data logging profiles per project and by that differently useable per sequence variant
Factory Integration
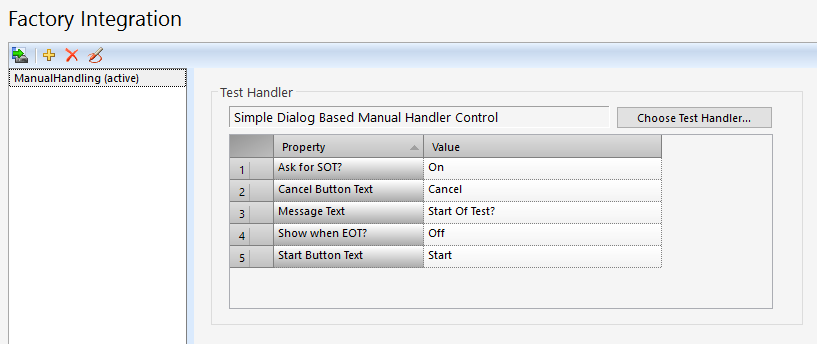
Every project can have its own Factory Integration.
Factory Integration contains the handling of the DUTS. Independently from handling manually by an operator, partly automated with a feed or fully automated with a robot, handler or prober. Additional information about the test rig (Touch downs, SPS status, …) can be shown.
- Support for any amount of Factory Integration modules per project
- Any amount of options per Integration Setup
- API for the integration of any production process
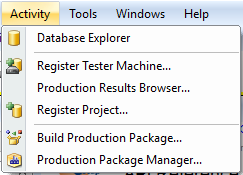
Production Package Manager
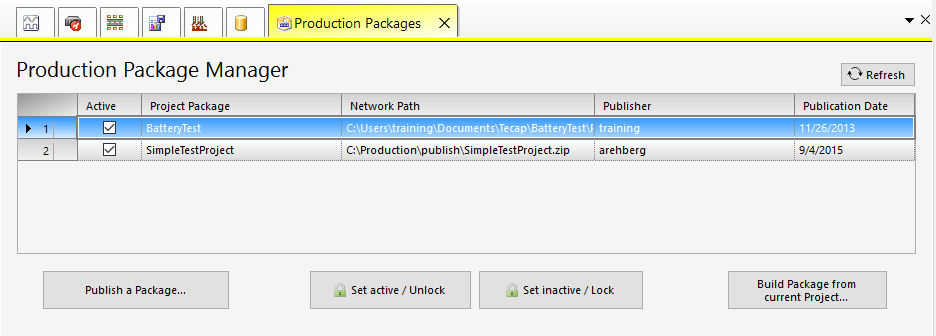
Production Package Manager helps in the management of production packages.
- Project clearance for production
- Dialogbased Wizard
- Only production packages can be started in Tecap Operator -> reliability of the production process
- Further development of already packed projects without interfering the production state
Activity Users
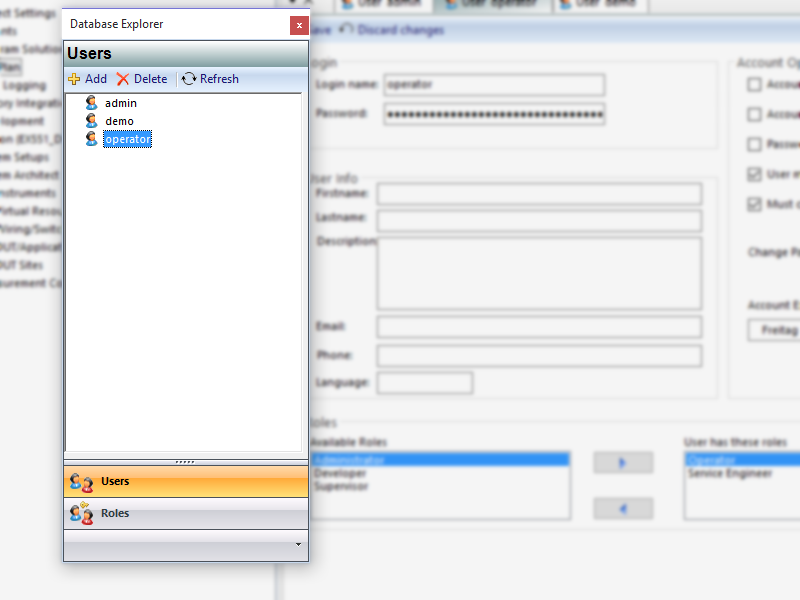
- Integrated user administration
- Role based access control
- Settings for expiration, names, departments, …
Activity Roles
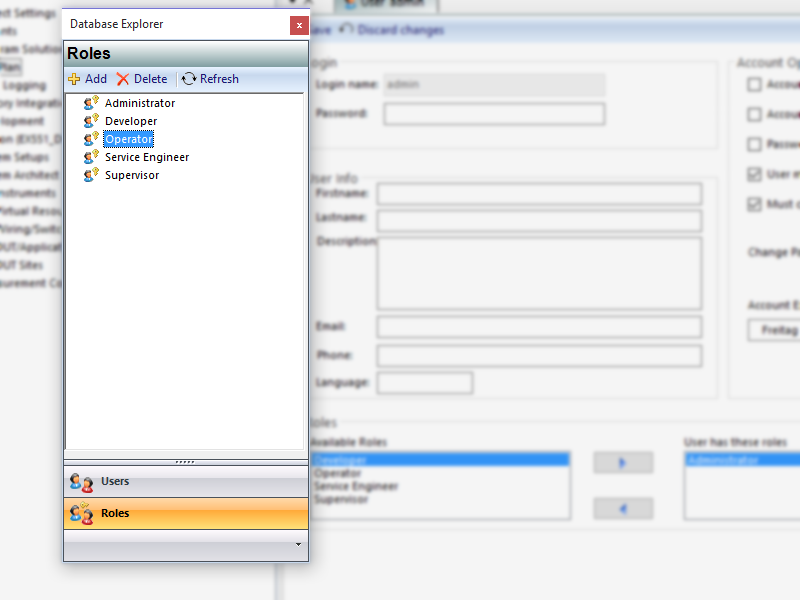
- Role based access control
- Simple user assignment
- Build your own roles
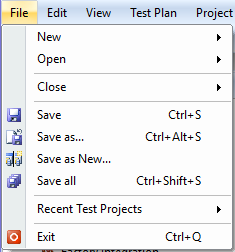
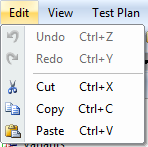
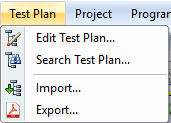
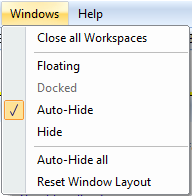
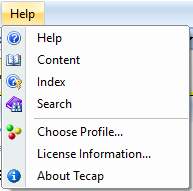
Menu Items
Tecap – Icon List
The tool bar offers quick access to standard functions.
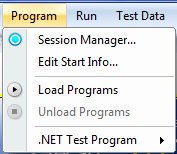
Session Manager
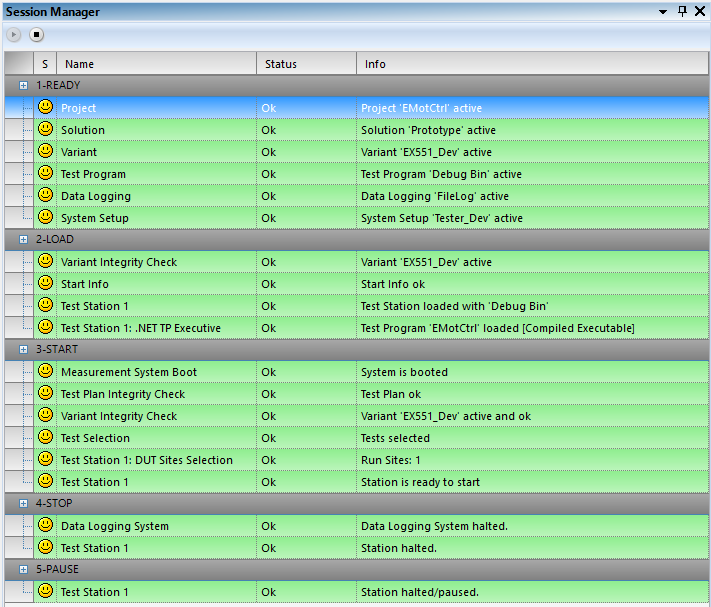
- Informs about the actual project load state
- Shows hints about missing or reasonable additional configuration
Output Window
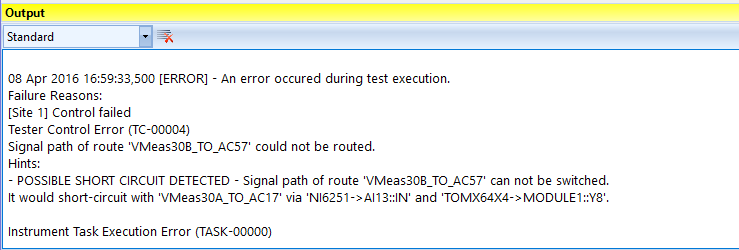
- Central information window for warnings and errors of all kind
- Divided in Standard, Debug, Measurement Center
Options Dialog
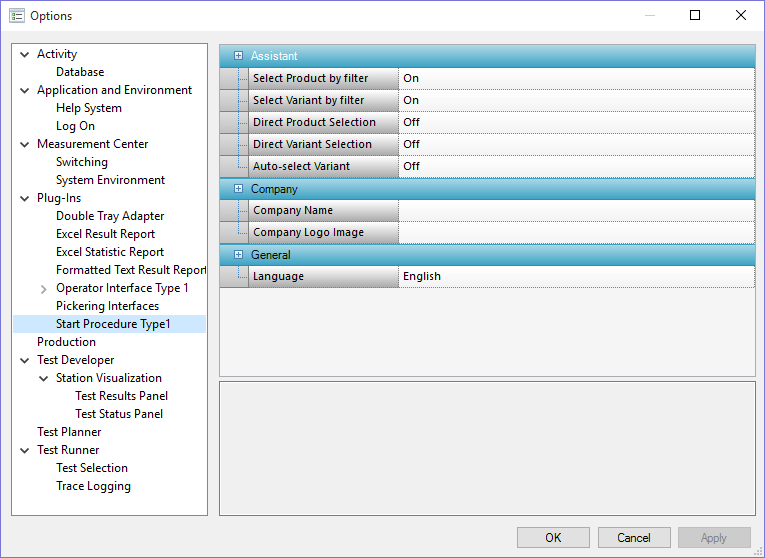
The options dialog contains numerous Tecap settings.
- Central place for setting options
- Settings for personalized Tecap visualization
- Each PlugIn can have its own options shown in this dialog
PlugIns
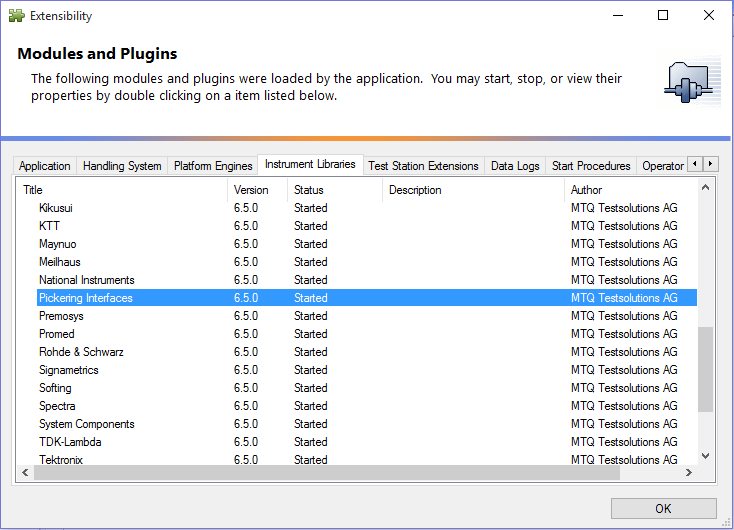
The PlugIn window shows information about all loaded PlugIns. Description, Author, HD path
- Listing of all loaded PlugIns
- Intuitive split in Application, Handling Systems, Instrument Libraries and production PlugIns
- API for your own functions in Measurement Center, Factory Integration or any other process for development or production
Help
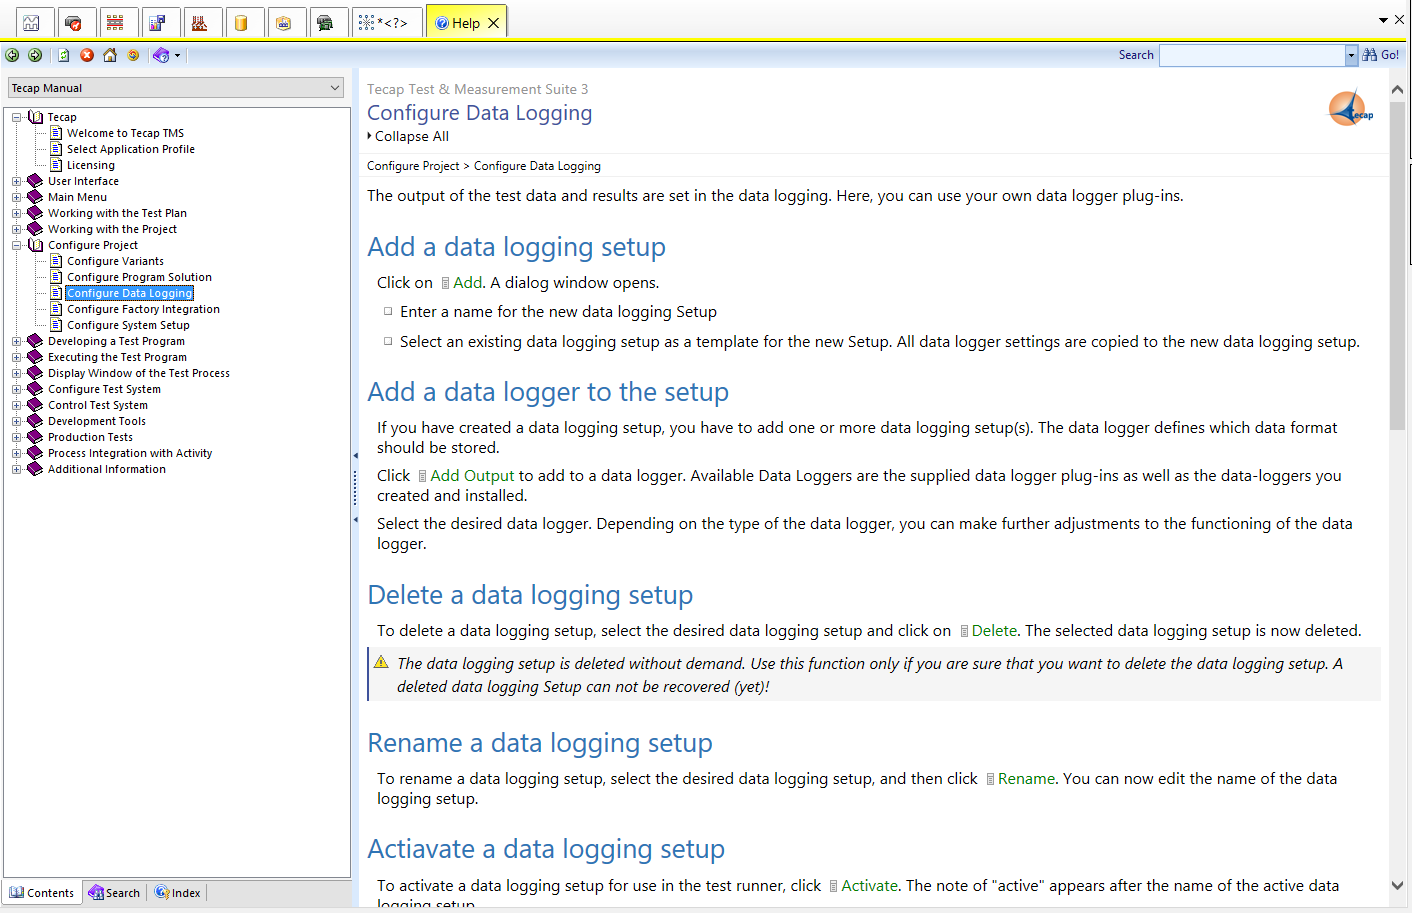
The integrated help shows information about the gui and the topic behind it.
- Comprehensive help in english and german
- Chapters
- Search
- Index
- API description
Tecap – API
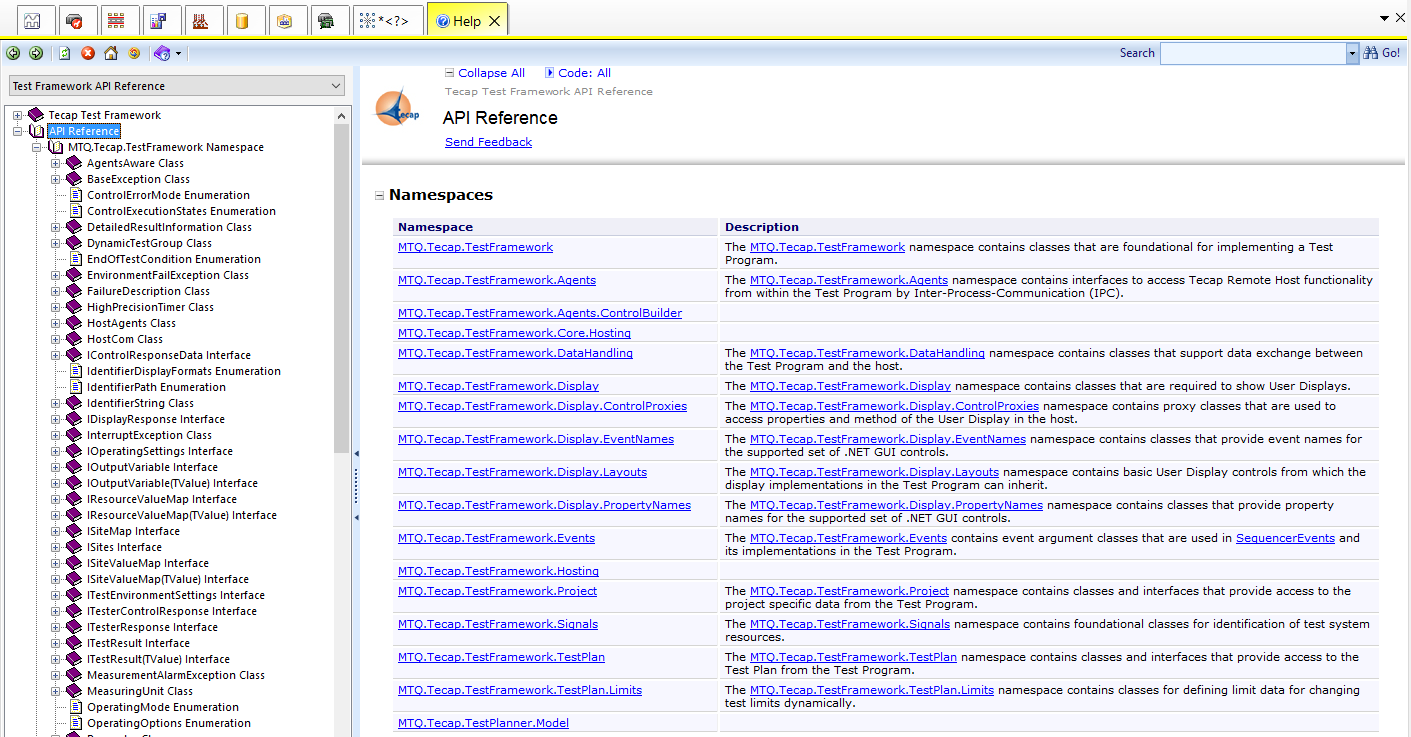
To write PlugIns for Tecap, a developer needs access to the software by a API – Application Programming Interface.
- API for many development possibilities
- Integration of your own instruments
- Process flow and preparative operation
- Factory integration
- API documentation in the Tecap Help